The earliest references that I can find about the measurement of helium D3 line is
D'Arrest, H. L. (1872). Über die Position der Lichtlinie D3 im Protuberanzspectrum. Astronomische Nachrichten, 79, 1. (On the position of D3 line in the prominence spectrum). For serious academic work, the 2 paged article need to be fully translated. You also need to see "Schellen's Spectralanalysis, 1871 p.380," cited there. DeepL is a very good translator, but you might need a lot of text pre-processing to get a decent translation. The machine translation methodology has been published in Journal of Chemical Information and Modeling.

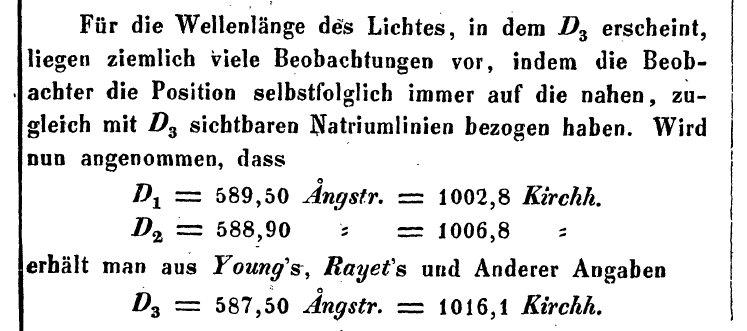
For the wavelength of the light in which $D_{3}$ appears, quite a lot of observations are available, in that the observers have always related the position itself consequently to the near sodium lines visible at the same time as $\boldsymbol{D}_{\mathbf{3}}$. If it is now assumed that
$$
\begin{array}{l}
D_{1}=589,50 \text { angstr. }=1002,8 \mathrm{Kirchh} \\
D_{2}=588,90 \quad=\quad=1006,8 \quad=
\end{array}
$$
we get from Young's, Rayet's and other data
$$
D_{3}=587,50 \text { Angstr. }=1016,1 \text { Kirchh }
$$
Translated with www.DeepL.com/Translator (free version)
Sadly he does not cite Young's paper but there is a footnote
*) Rayet has e.g. $1016,8 \boldsymbol{K}$ which leads to $587,4 \boldsymbol{A} .$. If, on the other hand, in Schellen's Spectralanalysis, 1871 p.380, $D_{3}=588,27$ is set, this large deviation comes from the fact that all three $\boldsymbol{D}$ - lines appear at the place obviously about 0,93 too large.
In older times it appears that people were often unaware of previous works so measurements appear again.
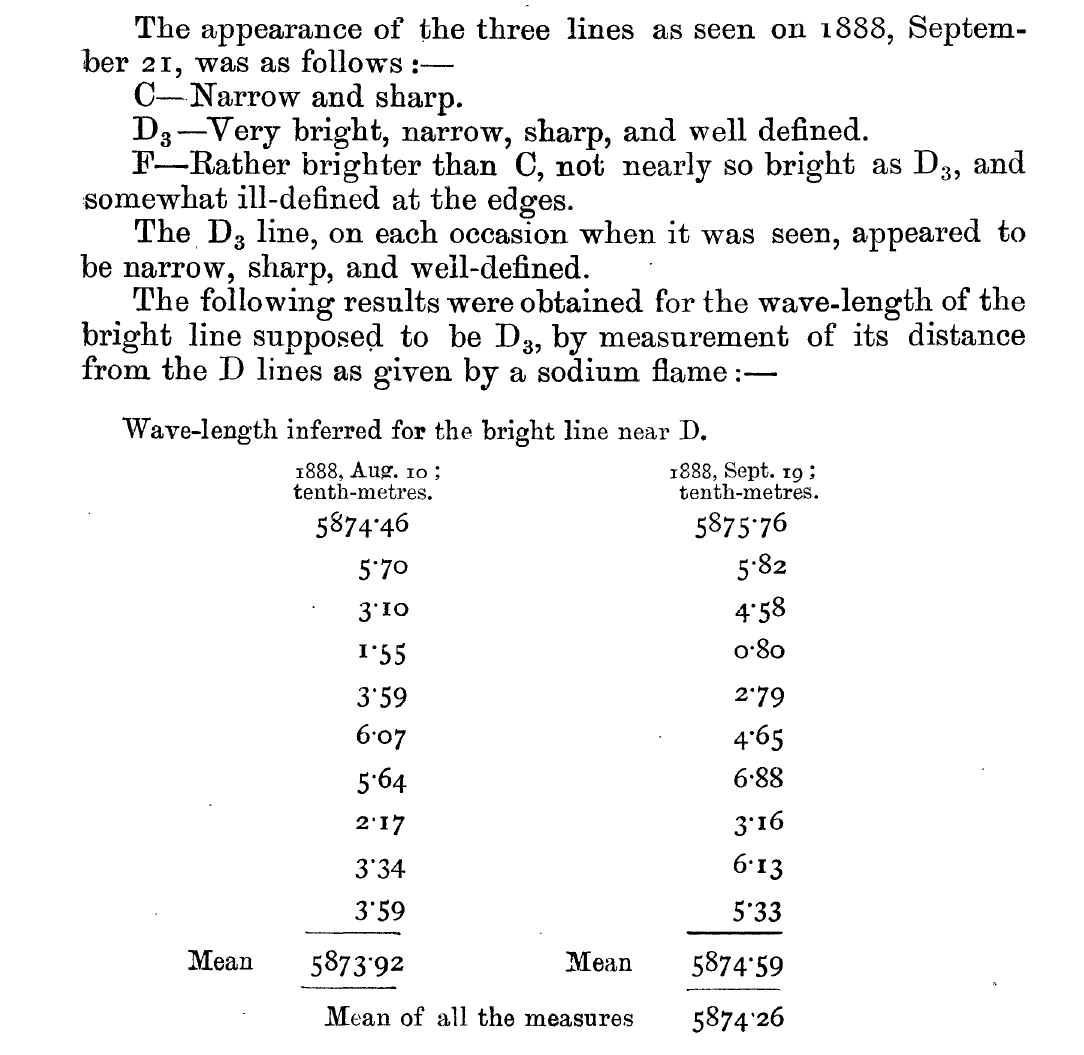
Maunder, E. W. (1889). Spectroscopic observations of sundry stars and comets made at the Royal Observatory, Greenwich, chiefly in the years 1887 and 1888. Monthly Notices of the Royal Astronomical Society, 49, 300.
This seems to be the first because this paper does not give any reference to previous works.


